ERV Installation Case Studies from Indian Projects
Real installations. Real numbers.
Every case study below is based on actual engineering analysis for Indian conditions. We publish the numbers because we stand behind them — and because an informed buyer makes a better partner.
1000 CMH DX Smart Ventilation — AC Downsizing Analysis
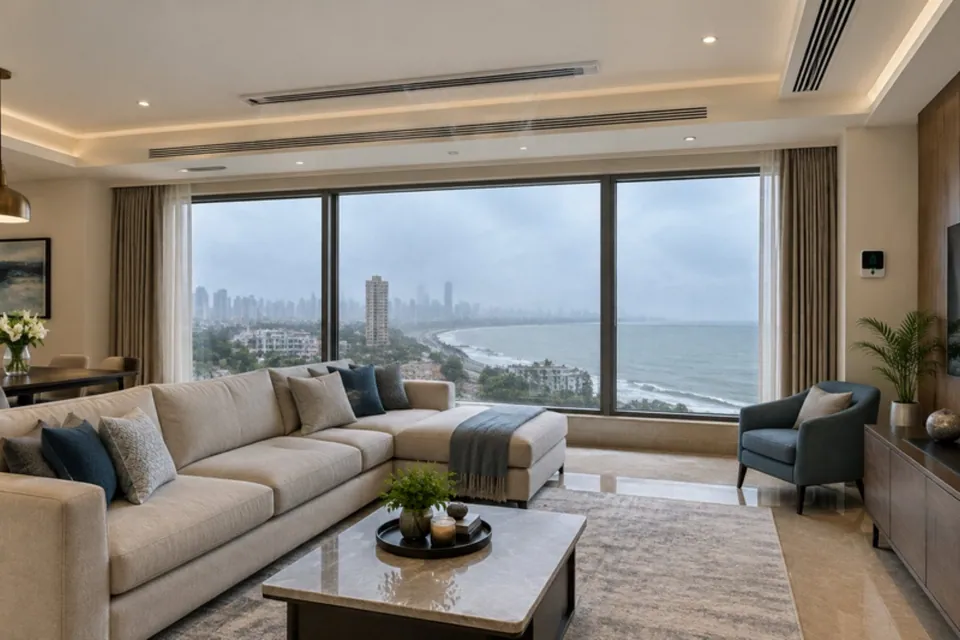
A 4,000 sq ft premium apartment in Mumbai with smart occupancy-based ventilation logic. The analysis integrates InAir's DX ventilation performance with CO₂ + RH-based fan modulation and documents annual energy, AC downsizing benefits, and payback period.
| Condition | Fan Operation | DX Logic |
|---|---|---|
| Vacant (>40% rooms empty) | Fan @ 50% speed | DX OFF or RH >70% only |
| Partially Occupied (60–90%) | Fan @ 75% speed | DX auto — RH >65% |
| Fully Occupied (90–100%) | Fan @ 100% speed | DX active per humidity |
| Component | Annual Energy | Annual Cost |
|---|---|---|
| DX Compressor | 6,132 kWh | ₹61,320 |
| Smart Fan (occupancy controlled) | 1,314 kWh | ₹13,140 |
| Total System | 7,446 kWh | ₹74,460 |
| Scenario | Conservative | Optimized | Best Case |
|---|---|---|---|
| AC Energy Saving / yr | ₹1,00,000 | ₹1,25,000 | ₹1,37,500 |
| InAir OPEX / yr | ₹74,460 | ₹74,460 | ₹74,460 |
| Net Annual Benefit | ₹25,540 | ₹50,540 | ₹63,040 |
| System Cost (indicative) | ₹3,50,000 | ₹3,50,000 | ₹3,50,000 |
| Payback Period | ≈1.9 years | ≈1.4 years | ≈1.2 years |
Key takeaway: Occupancy-based ventilation and humidity-driven DX modulation reduce fan runtime from 8,760h to 5,256h — saving ~40% fan energy. Latent load reduction enables 10–20% AC tonnage downsizing, giving 1.2–1.9 year combined payback.
2000 CMH — InAir ERV+DX vs InAir ERV vs Decentralised Competitor
For large villas and bungalows (6,000–8,000 sq ft), fresh air requirement typically reaches ~2,000 CMH. This analysis compares three approaches head-to-head on energy costs, installation complexity, and Indian suitability.

| System | Monthly Cost | Monthly Saving | Annual Saving |
|---|---|---|---|
| InAir ERV+DX (2000 CMH) | ₹6,000 | ₹24,000 | ₹2.9 lakh |
| InAir ERV (2000 CMH) | ₹14,400 | ₹16,000 | ₹1.9 lakh |
| Decentralised competitor (4–8 units) | ₹18–21,000 | ₹9–12,000 | ₹1.2 lakh |
| No ERV (baseline) | ₹30,600 | — | — |
| Parameter | InAir ERV+DX | InAir ERV | Decentralised Competitor |
|---|---|---|---|
| System type | Centralized | Centralized | Decentralized |
| Units required | 1 unit | 1 unit | 4–8 units |
| DX Cooling | ✓ Yes | ✗ No | ✗ No |
| Dehumidification | ✓ Active | ✗ No | ✗ No |
| AC Load Reduction | 70–85% | 50–60% | 30–50% |
| CO₂-based DCV | ✓ Yes | ✓ Yes | ✗ Not integrated |
| IAQ Sensors | ✓ Full suite | ✓ Full suite | ✗ Not integrated |
| PUF Insulation | ✓ Yes | ✓ Yes | ✗ Not standard |
| EC Motors | ✓ High efficiency | ✓ Yes | Mixed / AC motors |
| Indian conditions | ✓ Designed for | ✓ Designed for | Not calibrated for Indian conditions |
| Installation | Clean centralized | Clean centralized | Multiple penetrations |
| Maintenance | Single point | Single point | Multiple service points |
Smart Occupancy-Based Ventilation — Fan Energy Analysis
Comparing constant 24×7 operation vs intelligent occupancy-based fan modulation. This analysis shows how CO₂ and humidity sensor integration directly reduces operating costs — without compromising air quality.

| Mode | Avg Power | Annual Hours | Annual Energy | Annual Cost |
|---|---|---|---|---|
| Constant 24×7 (base case) | 0.25 kW | 8,760 hrs | 2,190 kWh | ₹21,900 |
| Smart occupancy-based (60% avg) | 0.25 kW | 5,256 hrs | 1,314 kWh | ₹13,140 |
| Month | Season | DX Hrs/Day |
|---|---|---|
| Jan–Feb · Nov–Dec | Winter | 2 hours |
| Mar–Jun | Summer (peak) | 10 hours |
| Jul–Sep | Monsoon | 5 hours |
| October | Post-Monsoon | 4 hours |
3 BHK Apartment — Hyderabad, Under Construction
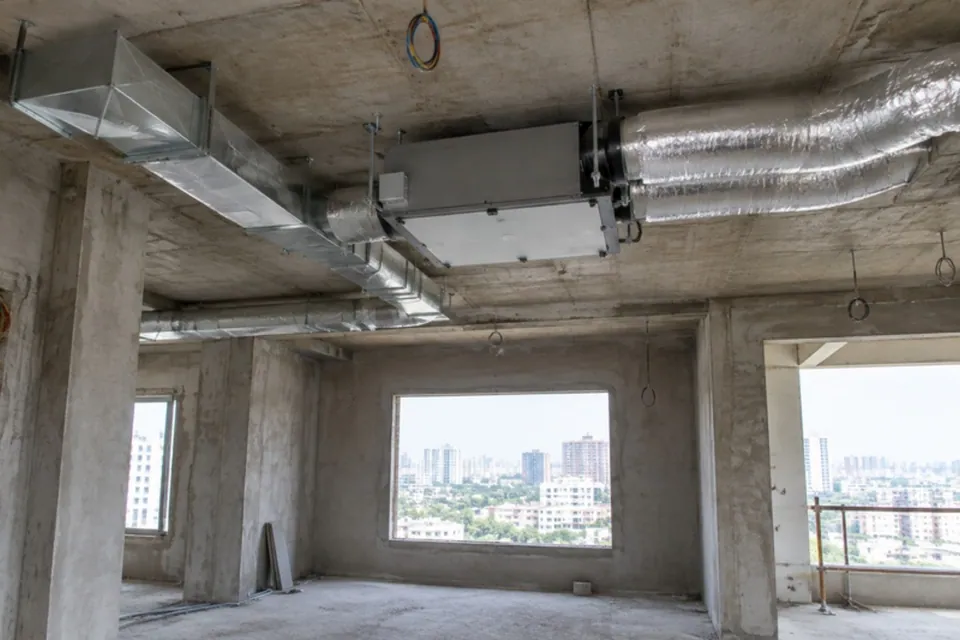
The most common Inair customer: a 3BHK apartment owner building in Kondapur or Gachibowli, asking whether to include a fresh air system during construction. This analysis documents a typical installation — airflow sizing, system cost, and what changes after day one.
| Parameter | Without Inair | With Inair ERV |
|---|---|---|
| Bedroom CO₂ at night | 1,200–2,000ppm (heavy, disrupted sleep) | <800ppm (ASHRAE well-being zone) |
| PM2.5 indoor | Equals or exceeds outdoor AQI | 95%+ reduction via MERV-13 / HEPA-13 |
| Allergen load | Recirculated via AC — accumulates | Continuously diluted and exhausted |
| AC load | Baseline | Slight reduction (pre-conditioned fresh air) |
| Audible noise | AC compressor and fan: 38–45dB | Inair: 25–28dB — below perception threshold |
| Item | Detail |
|---|---|
| System | 1 × INA-MFQR-350 (ceiling void) + flat duct to 3 bedrooms + living room |
| Installation phase | During false ceiling / MEP work — ducting routed cleanly before finish |
| Timeline | 10–12 days (runs parallel with AC and electrical fit-out) |
| Civil impact | 1 × 50mm external wall penetration. No wall hacking after civil finish. |
| Annual filter service | MERV-13 / HEPA-13 replacement every 12–18 months based on Hyderabad AQI |
Home Office — CO₂, Cognitive Performance & the 3pm Crash
For WFH professionals, sealed home offices with running ACs produce some of the worst indoor CO₂ conditions in a home — one person, one room, windows closed, CO₂ reaching 1500–2500ppm by afternoon. This documents exactly what changes with continuous fresh air ventilation.

| CO₂ Level | Condition | Cognitive Impact |
|---|---|---|
| 400–600 ppm | Outdoor fresh air standard | Baseline — optimal performance |
| 700–1000 ppm | Good ventilation (ASHRAE target) | Minor to no impact — target zone |
| 1000–1500 ppm | Poorly ventilated AC room (2–3 hrs) | 20% drop in complex decision-making |
| 1500–2500 ppm | Sealed home office, 4–6 hrs | 35–50% drop — drowsiness, errors |
| 2500+ ppm | Sealed conference room / bedroom | Significant — comparable to mild intoxication |
A WFH professional earning ₹1.5 lakh/month working 8 hrs/day: if CO₂ reduces productivity by 20% for 4 hours each afternoon, that’s effectively ₹30,000/month in lost output. Inair for a 2BHK costs less than 1 month of that productivity loss.
Delhi Winter — Fresh Air During AQI Spike Seasons
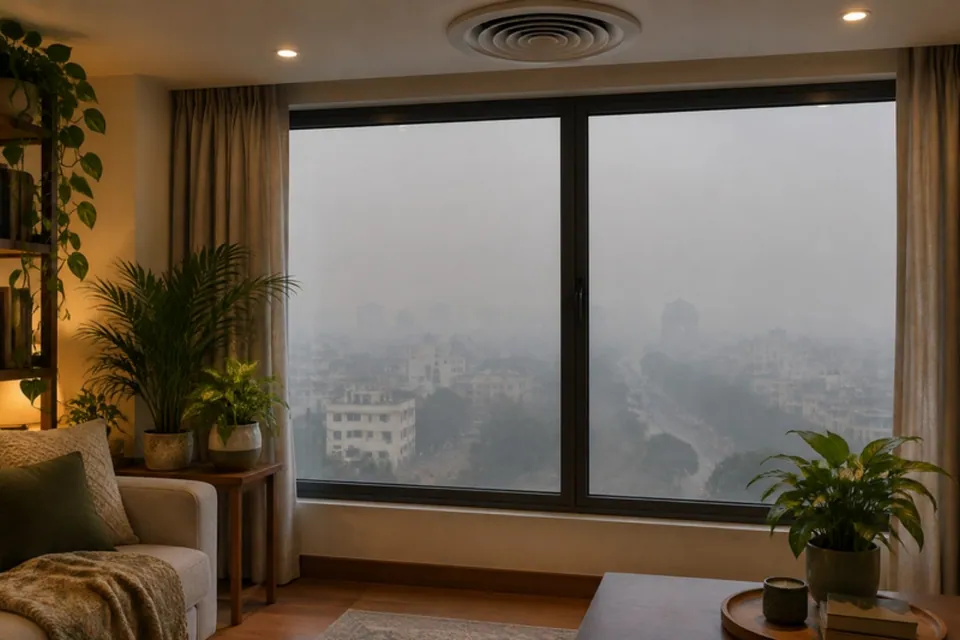
The most common objection in high-AQI cities: "we can’t bring in outdoor air in winter." This analysis addresses how Inair’s MERV-13 / HEPA-13 filtration + ERV heat recovery performs during Delhi’s worst air quality months — and why indoor air without Inair is often worse than outdoor air with it.
| Scenario | PM2.5 Level | CO₂ Level | Assessment |
|---|---|---|---|
| Sealed AC room (no ventilation) | Accumulates over hours | 1500–2500ppm | Worst option |
| Open windows (AQI 300) | 220μg/m³ directly | <600ppm | High particulate risk |
| Air purifier only (sealed room) | Reduced particulates | CO₂ still builds | Partial solution |
| Inair ERV (MERV-13 / HEPA-13) | ~11μg/m³ (| <800ppm | Best outcome | |
Bloomingdale International School — Advanced IAQ Intelligence Platform
InAir implemented a next-generation Indoor Air Quality system at Bloomingdale International School, transforming a large 6 lakh sq. ft. premium campus from conventional fixed ventilation into a fully adaptive, data-driven air quality ecosystem. The solution continuously senses, analyses, and responds to real indoor air conditions across classrooms, labs, corridors, auditoriums, and academic blocks.

Traditional ventilation systems operate at a fixed airflow rate — regardless of actual occupancy, CO₂ levels, or pollutant load. A classroom with 8 students gets the same air as one with 38. Result: under-ventilation when full, wasted energy when empty, and no visibility into actual air quality at any point.
| Trigger | System Response |
|---|---|
| High CO₂ | Increased fresh air supply — occupancy-driven ventilation |
| High PM2.5 spike | Enhanced filtration mode + increased airflow rate |
| High VOC levels | Rapid air flushing — purge mode activated |
| Low occupancy / vacant | Reduced airflow — energy saving mode |
| Dimension | Result |
|---|---|
| IAQ monitoring | 7-parameter continuous monitoring across all classrooms |
| Cognitive performance | CO₂ maintained in ASHRAE well-being zone — reduces afternoon fatigue |
| Energy efficiency | Demand-controlled operation — fans run only when rooms need ventilation |
| Management visibility | Central BMS dashboard — identify problem zones in real time |
| Compliance | ASHRAE 62.1 ventilation standards met across all zones |
ESG & sustainability: Demand-controlled ventilation reduces unnecessary fan and HVAC energy consumption. The system provides documented, time-stamped air quality data for governance, parent communication, and sustainability reporting — supporting the school's ESG commitments.
We'll model your space
before we sell you anything.
Get a free site survey and receive a detailed analysis — airflow, energy savings, payback period — for your specific home or building.
Further reading
- InAir Ventilation Systems India: Complete Range, Applications and Why It Matters
- Demand-Controlled Ventilation in India: CO₂ Sensors, IoT and Smart Building IAQ
- Why Fresh Air Ventilation is Now Non-Negotiable in India: The Case for ERV Systems
- Smart Home Ventilation in India: IoT, CO₂ Control and Automated Indoor Air Quality